| OVERVIEW | TUTORIAL | ABOUT | DOWNLOAD SQUAD (v2.0) |
|---|
SQUAD Tutorial
Introduction
SQUAD is a software for the dynamic modelling of regulatory networks using a standardized qualitative dynamic approach. Briefly, this methodology uses a Boolean modelling technique to identify all the stady states of a network solely based on the topology (i.e. without the need of fitting kinetic data). A system of standardized ordinary differential equations is then used to simulate the dynamic behaviour of the network in time. This detailed tutorial provides details on how to use SQUAD. If you are using software for the first time we reccomend using the QUICK-START istructions before looking at the detailed tutorial.
The methodology can be divided in four parts, accessible through the links below:
For a description of the file formats used by ENFIN:SQUAD:
LOADING A NETWORK
There are three tab windows, named General info, Dynamic
simulation and Simulation data. You are able to
navigate among them at any time, but their buttons and actions might be
deactivated until some appropriate data appear. By default, SQUAD
presents to you the General info tab, where data regarding the loaded
data is displayed.
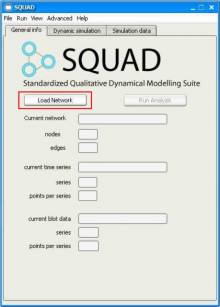
Data describing the topology of the network can be loaded into
squad using the Load network button or using the File
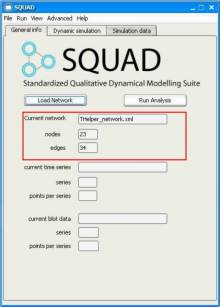
menu. After loading a network, the General info tab of SQUAD will
display three basic information items: the name of the
loaded file, the number of nodes and the number
of edges (interactions) of the network.
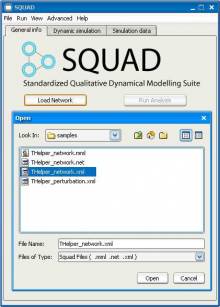
SQUAD supports three different file formats: net, mml
and xml:sbml. The SAMPLES FOLDER
in the SQUAD installation directory provides examples of all of
these file formats. A description is provided in the FILE FORMATS
section of the tutorial.
Network visualization
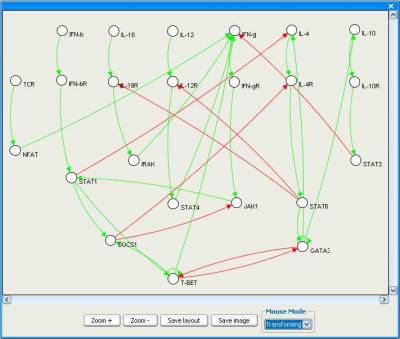
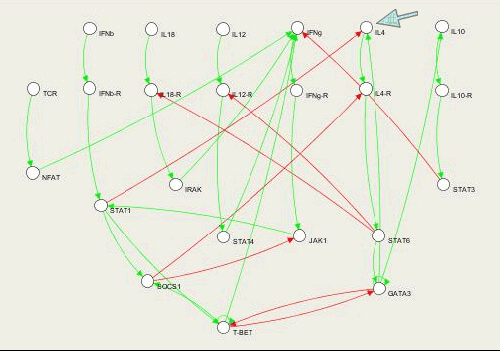
Once the network has been loaded, it is possible to display its
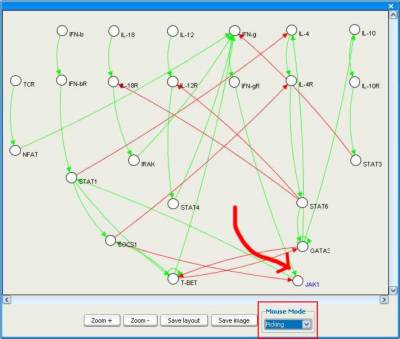
graphical representation by selecting the
View|Graph menu option.
In this representation:
                                 > nodes are shown as circles
                                 > positive interactions as green arrows
                                 > negative interactions as red arrows
When the Mouse mode is set to transform The Graph
Visualizer allows to ZOOM and PAN,
while in the picking mode the NODES CAN BE MOVED.
The Save layout button saves the layout of the nodes in
memory. Importantly, the layput will be lost when SQUAD is closed. To save
the layout, the network has to be saved in mml format, using
the file menu. The Save image button allows to
save the visualization as a file.
IDENTIFICATION OF STEADY STATES
Using SQUAD we can analyze the long-term dynamical properties of the
network, through the identification of steady states. This can be done
by pressing the Run analysis button or selecting Run|Analysis
of on the menu. A progress bar appears during the computation.
SQUAD identifies all the steady states of the netowrk usign a Reduced Order Binary Decision Diagram (ROBDD) algorithm. Using this methodology we can compute a set of subsequent states from an array of network states a in a single step. Hence, the state-space traversal can be performed very efficiently. Our implementation optimises the use of ROBDDs by finding steady states without testing all the possible states of the network, allowing analysis of large regulatory networks.
The steady states are identified using a discrete boolean model, where
the nodes are described as active (value =1) or inactive (value=0). In
order to identify the corresponding steady state in a continuous model
(i.e. where the activity can also be expressed by intermediary values
comprised between 0 and 1) SQUAD automatically performs a dynamic
simulations for each steady state identified. This feature can be
disabled using the
Analysis|Settings menu. Once the analsysis is finished the
dynamic simulation panel will appear.
 The number of identified steady states are reported on
the top right corner of the panel.
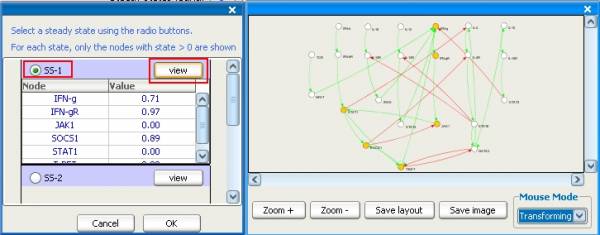
To view the details of each steady state, click on the
 Load
States button, the steady state selector panel
will appear. For each steady state a table lists all the nodes with
value > 0. To graphically overlay the steady state on the network
graph click on the View button. The following color codes
apply
                          > RED, Node value = 1
                          > YELLOW, Node value < 1 AND > 0
                          > WHITE, Node value = 0
DYNAMIC SIMULATION
Running simulations
While the number and location of the stable steady states of the network constitutes the central information on the dynamical behavior of the system under analysis, it is possible to study its transitory behavior from a given initial state until it reaches a steady state. This can be done by indicating the initial values of all the variables representing the activation state of the nodes.
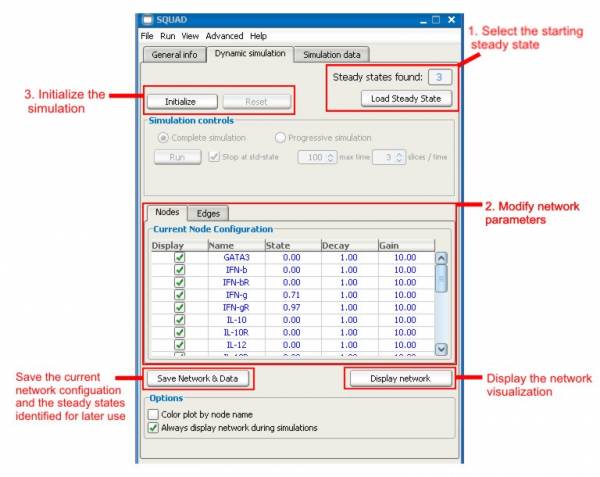
Below is a screenshot of the dynamic simulation panel, showing the sequence of events to perform a simulation.
By default, SQUAD takes as initial state one of the steady states of the system, but you can select a different initial state using the (1)Steady state selector and/or change any state values (in the closed interval between 0 and 1) using the (2)nodes parameters table. Additionally if the data is available the parameters for the Decay and the Gain of each node can be modified.
Once the initial state of the dynamical has been set, it is possible to
run a simulation, by pushing the (3) Initialize
button. At this point the parameters are loaded into the SQUAD ODE
solvers, the parameters table becomes un-editable and two new windows
appear, a plot and a network graph. Following the initialization of the
display you can launch the simulation using two options complete
or progressive, depicted below.
- Complete simulation: runs the entire simulation until a steady state is reached, or a user-set timepoint
- Progressive simulation: runs the simulation in a step-wise manner
By default in the complete simulation the simulation
stops when a steady state is reached. Altenratively the user can
un-check the stop at steady state checkbox and specify a
maximum timepoint to be reached together with the number of steps/time
point. At the end of the simulation the results tab will appear.
In the progessive simulation you can start
or stop the simulation using the appropriate buttons. the
speed slider allows to control the speed of the simulation. To view the
numerical results, press the results button. Alternatively
the reset button allows to reset the simulation.
The simulations are associated to two type of visualizations:
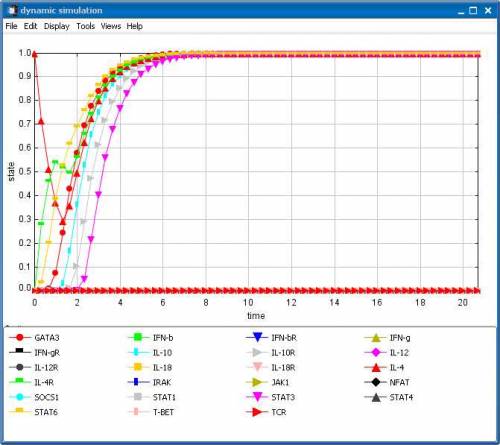
- The activity plot, shows the activity of each node in function of the simulation time
- The graph plot, shows the activity of the nodes through the graph visualiation, where the color of the nodes ranges from white (activity = 0) to black (activity = 1).
In the progressive mode the graph plot
is particularly useful to visualize how a signal propagates
through the network. By default the graph plot is shown with
each new simulation, this can be disabled by un-checking the Always
display network during simulations checkbox in the options
group.
Viewing the results
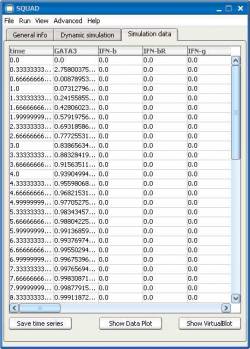
Data is presented in tabular form, with the values of the variables presented for a series of small discrete time steps, starting from the indicated initial state, until the system reaches a steady state. This table is not editable, but the values can be saved, in a plain text file with tab-separated values, either by pushing the Save time series button, or selecting the File | Save simulation data menu option.
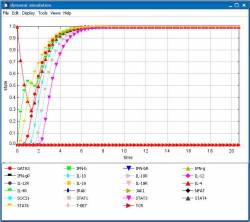
Besides the numerical data, which is very useful for mathematical analysis, it is also possible to visualize the behavior of the dynamical system. SQUAD provides two visualization methods. The first is the canonical time-series plot, which appear in a separate window by pressing the Show time series plot button or selecting the View | Simulation as a time-series plot option.
This plot can be printed and/or saved and/or customized by changing colors, axis labels, title and scale with a context menu that appears when right-clicking inside the plot.
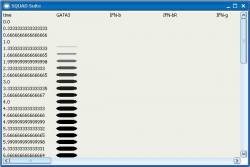
The second form of visualization provided by SQUAD is what we call a VirtualBlot, which appears by pushing the Show VirtualBlot button or selecting the View | Simulation data as VirtualBlot option. The VirtualBlot represents the data in the same tabular form presented before, but instead of presenting the levels of activation as numbers, the values are presented as blots (as in dot-blots, phospho-blots, western-blots, etc.), where the width and intensity of bands are proportional to the activation of the nodes.
Up to now, we have described a continuous analysis pipeline starting from a network topology, up to the visualization of the dynamical behavior of the dynamical system describing such network. But, as we mentioned, data can be saved at different points of the analysis. This characteristic permits to start the analysis from different starting points, or from different variants of a given model. Indeed, in the File menu option you can see that it is possible to load not only a network topology, but also a previously saved files such as time series or virtual blots.
Since SQUAD needs only the time series data to make a graphic display, either a time series plot or a VirtualBlot, the software can be used not only as a network analysis tool but also as a visualization software of any time series that you might have as a tab-separated text file.
PERTURBATIONS
Perturbator Tool
The Perturbator tool allows to change the properties of a network during
the simulation. The tool can be opened using the Advanced|Perturbator
menu. The perturbations can affect all the aspects of the continuous
system such as the state of a node, it's decay rate or the gain. It is
thus possible to study complex network behaviours by performig
sequential modifications during the simulations. The perturbations are
defined in a file named Protocol
which can be created using the Edit protocol button or
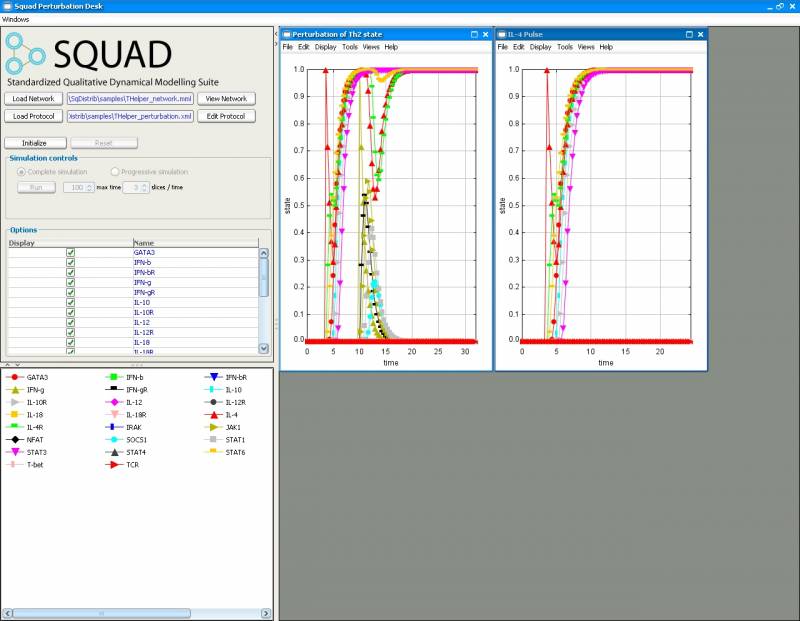
loaded using the Load Protocol button. Below is a
screenshot of the perturbator tool
Protocol Editor Tool
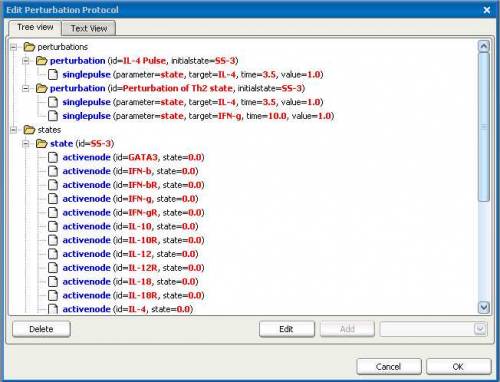
The protocol Editor tool that helps to create or modify a Protocol File.
We have designed this tool to quickly generate protocol files without
the need manually edit the raw protocol files.
The structure of the underlying protocol file can viewed by clicking on
the Text View tab.
If a protocol file has not been loaded in the Perturbator tool, the editor will display a default set of parameters (see Protocol File format for the details). If the steady states analysis has been performed, the steady found will be listed in the default protocol file to be used as initial state for the simulations.
Using the Editor you can:
- Add a new Perturbation: Each perturbation will generate a new simulation. click on the
perturbationsnode and clickAdd - Add a new Action-Node: Action nodes are associated to a perturbation and describe the modification to be performed to the network. click on the perturbation to which the node needs to be added, choose the type of action node to be added and click
Add - Add a new State: A state defines an initial configuration used to start the simulations. click on states node and click
Add - Add a new Active-Node: Each active-node element is associated with a state and defines the activation state of a node. click on states node to which the node needs to be added and click
Add
It is also possible to modify the properties of an existing node by
selecting the node and clicking on the Edit button.
Alternatively the node can be deleted with the Delete
button.
Upon exit, the changes in the protocol can be saved to file. If you choose NOT to save the protocol to file, the modified protocol will remain in memory and be used in the for the simulations, but will be lost upon exiting the Perturbator tool.
Protocol file format
The Protocol for perturbations is described in xml format as shown in the example below or downloaded (THelper Perturbation). The file describes two simulations (IL-4 Pulse and Perturbation of Th2 state), both use the state TH0 as an initial state for the simulations. In the first simulation IL-4 is added at time 3.5. In the second simulation, after addtion of IL-4, IFN-g is added at time 10.0.
<protocol level="1.0">
  <perturbations>
    <perturbation id="IL-4 Pulse" initialstate="TH0">
      <singlepulse parameter="state" target="IL-4" time="3.5" value="1.0" />
    </perturbation>
    <perturbation id="Perturbation of Th2 state"
 initialstate="TH0">
      <singlepulse parameter="state" target="IL-4" time="3.5" value="1.0" />
      <singlepulse parameter="state" target="IFN-g" time="10.0" value="1.0" />
    </perturbation>
  </perturbations>
  <states>
    <state id="TH0" />
    <state id="TH2">
      <activenode id="GATA3" state="1.0" />
      <activenode id="IL-10" state="1.0" />
      <activenode id="IL-10R" state="1.0" />
      <activenode id="IL-4" state="1.0" />
      <activenode id="IL-4R" state="1.0" />
      <activenode id="STAT3" state="1.0" />
      <activenode id="STAT6" state="1.0" />
    </state>
    <state id="TH1">
      <activenode id="IFN-g" state="1.0" />
      <activenode id="IFN-gR" state="1.0" />
      <activenode id="IL-12R" state="0.0" />
      <activenode id="SOCS1" state="1.0" />
      <activenode id="T-bet" state="1.0" />
    </state>
  </states>
</protocol>
The protocol file is devided in two parts:
- the perturbations section contains a list of perturbations to perform. For each perturbation a simulation will be performed
- the states sections contains a list of states that can be used to as starting states for the simulation
Perturbation Element
Specifies an initial state and list of modifications to perform. Each
perturbation element describes a separate simulation. The perturbation
node contains Action-Node
sub-elements that describe all the modifications to perform.
<perturbation id="IL-4
Pulse" initialstate="Th0">
Attributes:
id→ contains a descrition of the perturbation.initialstate→ refers to a state id that is used as an initial state for the simulation.
ActionNode Element
Describes a modification of the properties of the network at a given timepoint during the simulation. Different type of action nodes exist according to the duration of the modification:
SINGLEPULSE The modification is performed once, at a
given timepoint
<singlepulse
parameter="state" target="IL-4"
 time="3.5" value="1.0"
 />
RANGEPULSE The modification is perfomed constanly
through a specified time lapse
<rangepulse
parameter="state" target="IL-4"
 timestart="3.5"
timestop="5" value="1.0"
 />
CONSTANTPULSE The modification is perfomed
throughout the simulation, starting at a specified timepoint
<constantpulse
parameter="state" target="IL-4"
 time="3.5" value="1.0"
 />
Attributes:
parameter→ the parameter to modify [state, decay, gain].target→ the name of the target node to modify (has to match the name in the network file.time→ the time at which the modification starts (for singlepulse and constantpulse).timestart→ the time at which the modification starts (for rangepulse).timestop→ the time at which the modification stops (for rangepulse).value→ the modified value to set.
State Element
Describes a network state that can be used as an initial state for the
simulation. The state tag contains a list of Active-Node
elements that describe the state of each node in the network. If the
node is not specified it's value by default is 0 (inactive).
<state id="TH1">
Attributes:
id→ name of the state.
ActiveNode Element
Describes the state of a node, if not specified the node's default state
is 0.
   <activenode id="GATA3"
 state="1.0" />
Attributes:
id→ name of the node.state→ state of the node (between 0 and 1).
INPUT FILE FORMATS
net file format (.net)
This is the simplest input format. The contents of the file are lines describing signaling interactions between two nodes of the network, as follows:
A -> B
B -> C
A -> D
D -| C
C -| A
In this notation, it is possible to have only two types of interactions; namely, activations and inhibitions, represented by → and -| respectively. Also, notice that this format allows for the inclusion of self-interactions by repeating the name of a node at both left and right of an interaction. Finally, avoid using spaces in the name of the nodes.
mml file format (.mml)
This is an xml formatted file that contains information on the node connectivity in additon to data concerning the dynamic simulations such as the decay rates and the weight of the relationships. When saving network information from SQUAD, the mml file format will be used. This allows to save all the current simulation data. an example of mml file can be found in the samples folder of the squad application.
SBML celldesigner file format (.xml)
We integrated into SQUAD the possibility to read Celldesigner files. Celldesigner is a free graphical software for drawing biochemical pathways. It uses an extended version of SBML (systems biology markup language) to save the network data. When files deriving from Celldesigner are loaded into SQUAD, the layout of the nodes is mantained making the visualization and the study of the dynamic network more intuitive.
Celldesigner has orignally been designed for describing biochemical
pathways and therefore contains an exhaustive list of possible
biochemical interactions. For Boolean networks we use only two type of
reaction tags Activation → and Inhibition -|.
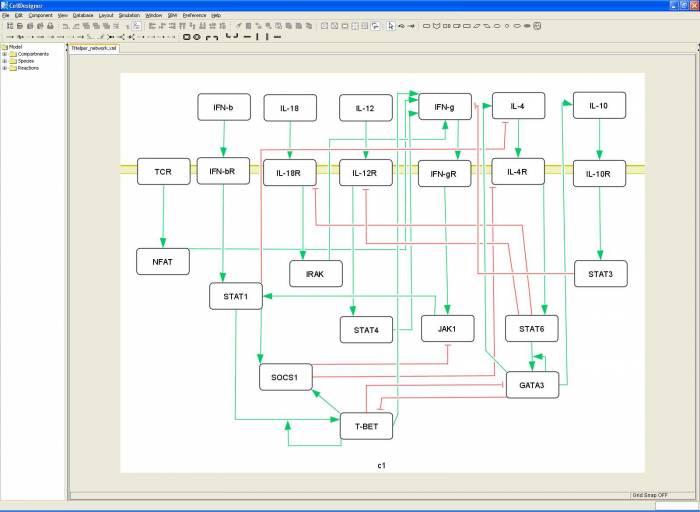
Below is a screenshot of the Thelper network drawn in Celldesigner 3.5, the underlying sbml file can be dowloaded here: THelper_SBML.

